This exercise is to increase our familiarity with histograms.
The histogram is a graph of visual brightness running from darks to lights (right to left). The number of pixels per level of brightness run from bottom to top.
More useful information about histograms can be found
here at the Luminous Landscape web site.
For this exercise I have taken nine photographs in groups of three. Each group represents a different picture scenario with one image exposed correctly and then one image over by 1 stop and one image under by 1 stop. We will look at each group of histograms and see what happens.
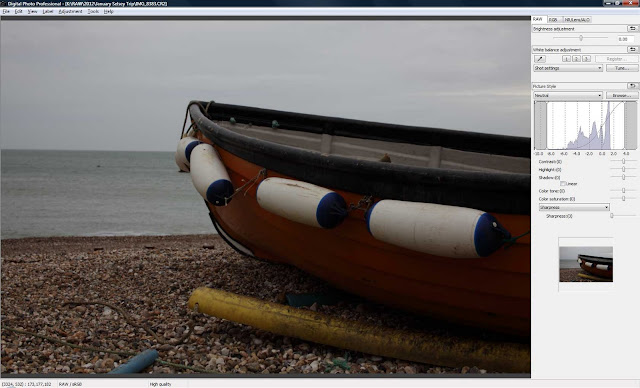
The first three images are of a fairly flat/low dynamic range. We can expect to see the pixels bunched together around the tone of the photograph.
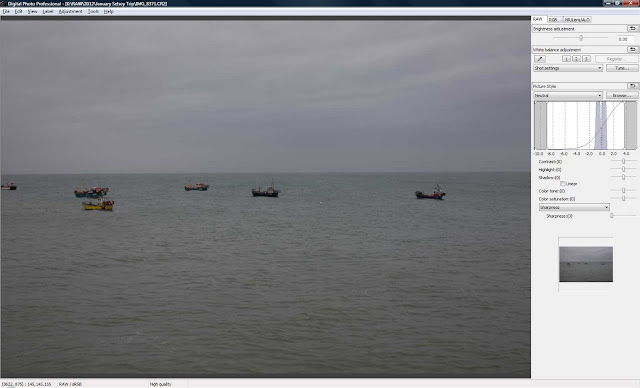 |
| F8 @ 1/100 ISO100 50MM |
As expected the pixels are grouped closely together as there is not a great deal of contrast. This image is correctly exposed using evaluative metering- it was a bit of a dull day! There is no highlight or shadow clipping which shows up as bright red areas for highlight and bright blue areas for shadow in the Canon RAW processor.
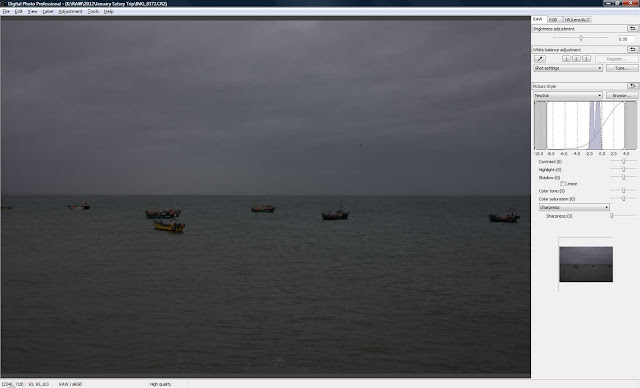 |
| F8 @ 1/200 ISO100 50MM |
The next shot is 1 stop under exposed. Clearly visible on the histogram is that the tonal range has shifted to the left. Still no highlight or shadow clipping.
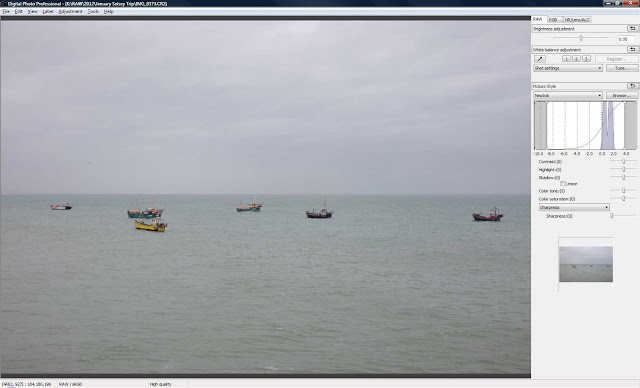 |
| F8 @ 1/50 ISO100 50MM |
The last shot in the first group is 1 stop over exposed. The tonal range has shifted to the right - to the brighter side of the histogram. Highlight or shadow clipping are still not evident. I must say I prefer the exposure on this shot even though it's one stop over by the camera's reckoning.
The second set of three images covers a broader range of contrast.
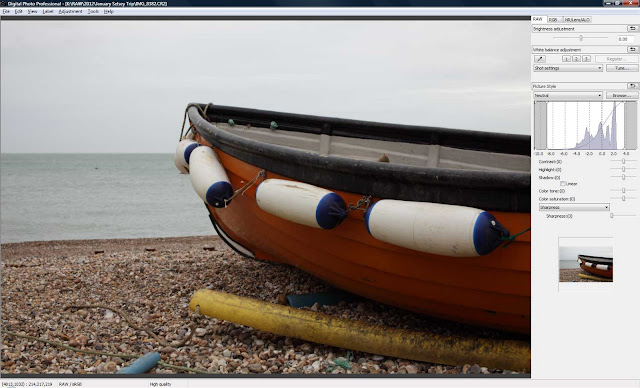 |
| F8 @ 1/50 ISO100 50MM |
Here the histogram clearly shows a larger degree of contrast. The histogram is wider and in fact covers almost 3/4 of the cameras dynamic range. The large peak at the right represents the large number of brighter pixels.
 |
| F8 @ 1/100 ISO100 50MM |
The same image at one stop over. Evaluative metering was used for all of these shots too. Again the graph has moved to the left to show the shift to darker tones. Not enough for any shadow clipping though.
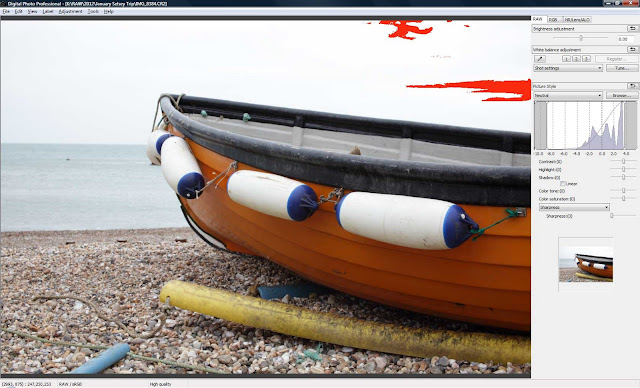 |
| F8 @ 1/25 ISO100 50MM |
Finally, 1 stop over. Highlight clipping has started to occur in the brightest part of the sky as can be seen by the bright red areas in the top right of the image. Looking at the histogram we can see the pixels are starting to extend out of the right hand side of the graph area.
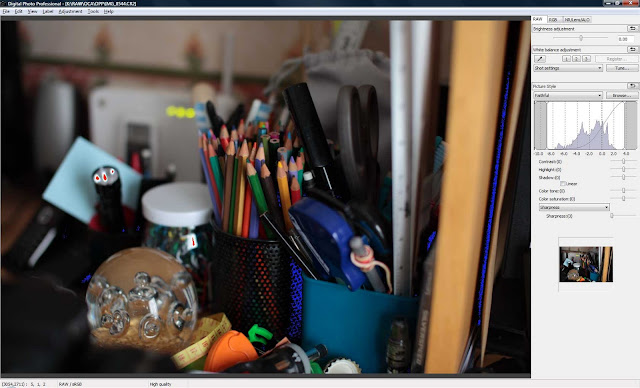
Now for the last image. Don't laugh but this untidy mess is my desk. The first series of shots I took for the high contrast section was carefully staged. After cleaning the windowsill I shot the row of cactus pots we have. The contrast however seemed to get a bit flattened by the light coming through the window and the histogram wasn't much wider than the one for the shots with the boat. When I was sitting at my desk looking at the shots I noticed that the immediate surroundings had a good range of tones so I shot that instead.
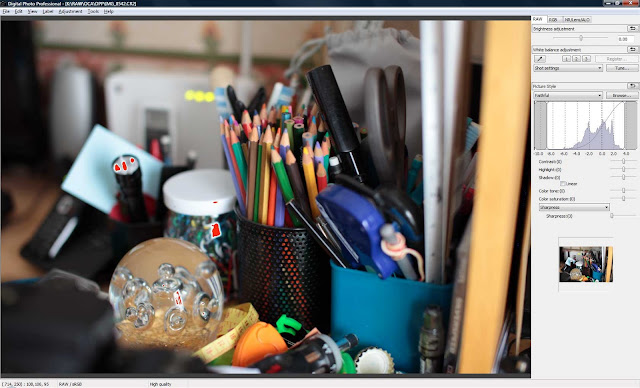 |
| F2.2 @ 1/20 ISO200 50MM |
In the first photograph which is correctly exposed, I have already had to make some decisions about exposure. For a good exposure I have allowed a very small amount of the highlights to clip. This can be seen by the bright red areas to the left of the photograph. Examining the histogram will show the tiniest part of the graph extending beyond the right hand edge of the graph range.
 |
| F2.2 @ 1/10 ISO200 50MM |
The one stop over-exposed version of this photo shows large areas of blown out highlights. We have lost a large part of the graph which has been clipped. These pixels no longer exist in our image.
 |
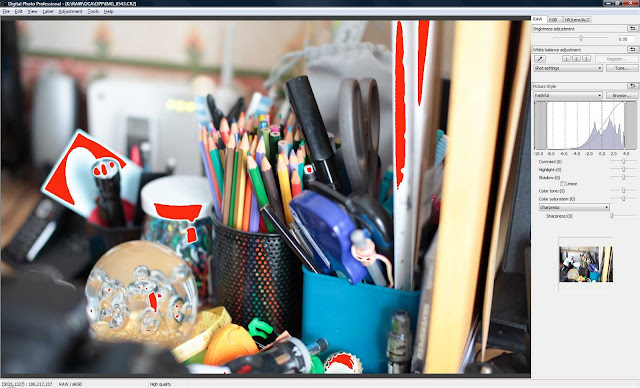
| F2.2 @ 1/40 ISO200 50MM |
And finally the one stop under-exposed version. The bright blue areas show where shadow clipping has occurred, namely on the side of the pencil pot and on the right of the image. This is nowhere near as much as the highlight clipping. Note that even though we are clipping the shadows,some of the highlights are also still being clipped.
In this final image we can clearly see that we have exceeded the camera's dynamic range - we are losing both shadow and highlight detail and should we wish to print this image, we would have to make a decision about which pixels to sacrifice!


